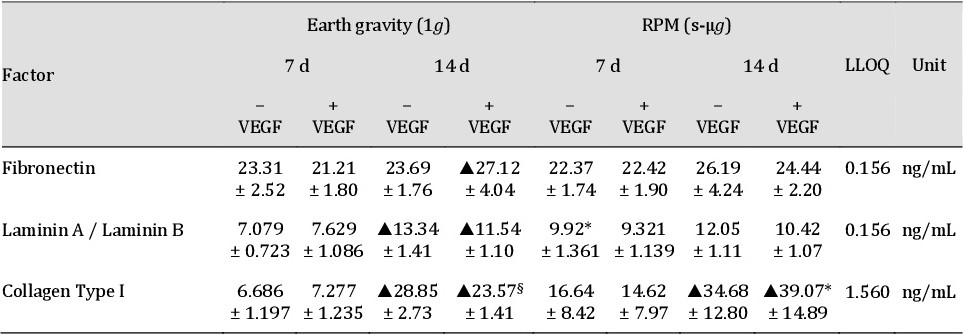
Table 3. Extracellular matrix proteins released by EA.hy926 cells after exposure to the RPM compared with 1g controls. Cells were cultured in slide flasks. The data was generated by using ELISA. Values are given as mean ± SD; *: P <0.05 vs. 1g; ▼|▲: P <0.05 vs. 7d; §: P <0.05 vs. −VEGF; LLOQ: Lower Limit of Quantitation, lowest concentration of an analyte in a sample that can be reliably detected